Today I will explain, how to create and monitor alerts.
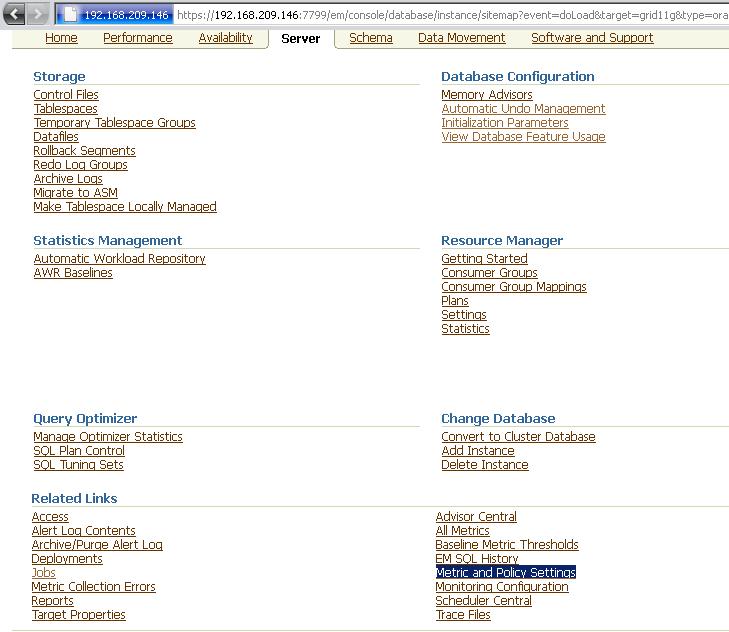
If you want to define a new metric, connecto to the database you want to monitor and click on the "Server" tab and then choose the "Metric and policy settings" option..
On the next screen, choose the metric you want to edit
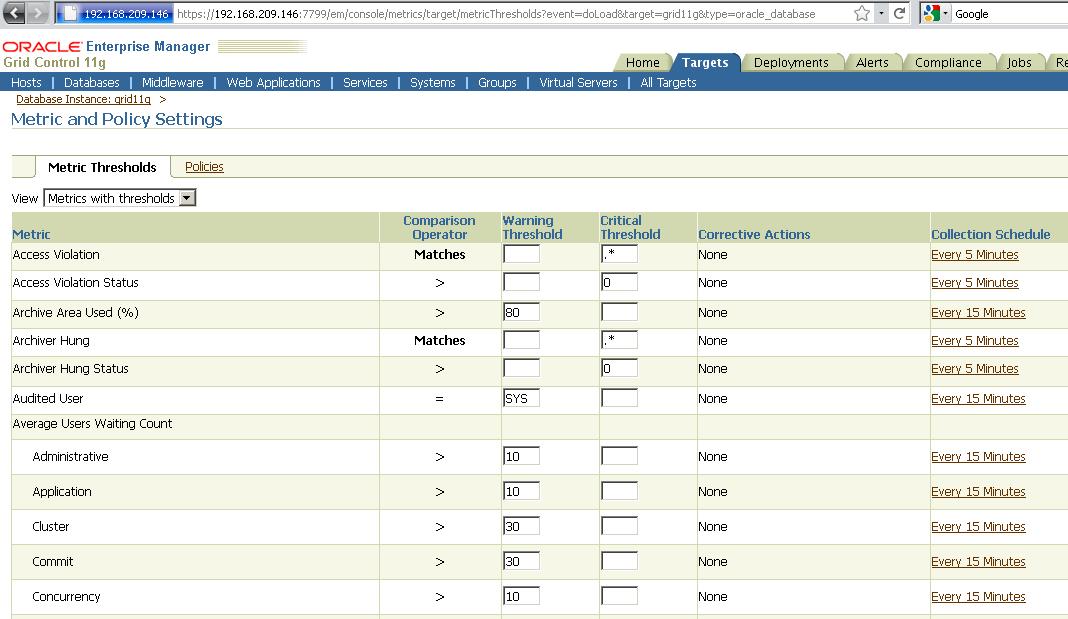
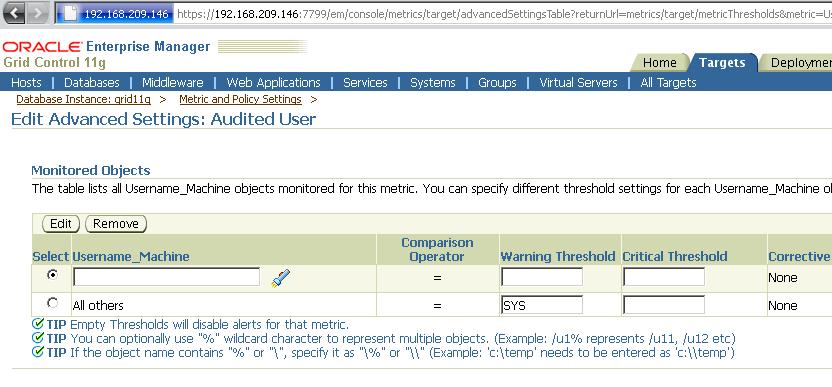
I have chosen the "Audited User". It will alarm me, whe "test" user will connect to the DB. Click on the Add button, to add new user.
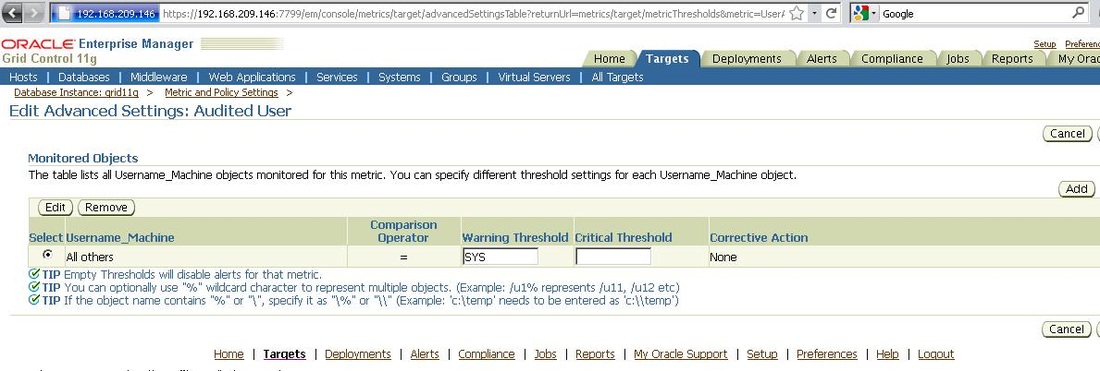
Here you can click on the "Flashlight" to choose the user and the target, or write it to appropriate columns.
Here you can check, what I have written in the fields:
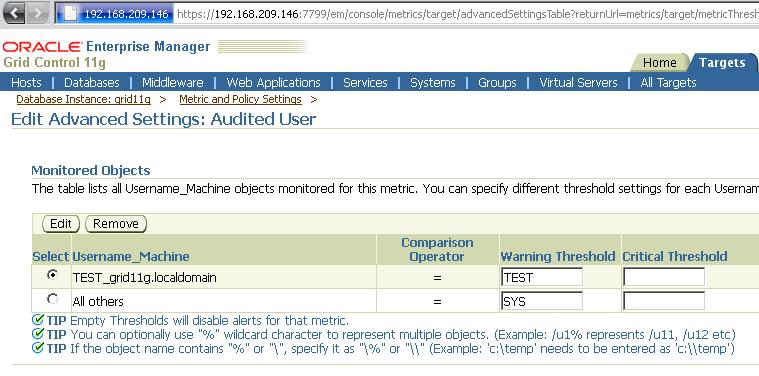
After that, click on the "Continue" button. You will see the message, that the settings were modified but you have to click on the "OK" button to save the data.
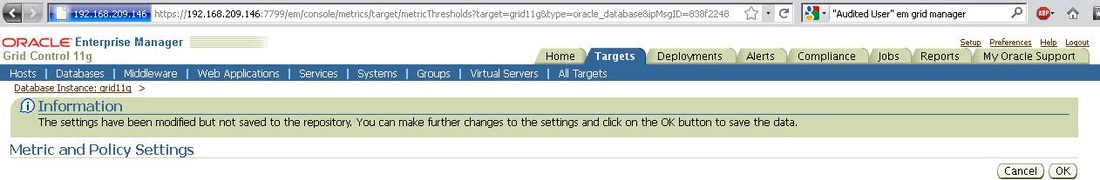
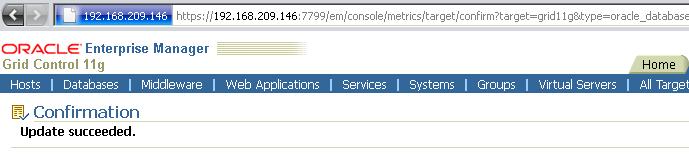
After you click on the "OK" data will be saved.
Now I will connect with the TEST user to the DB and alert will be generated.
[oracle@grid11g ~]$ sqlplus
SQL*Plus: Release 11.2.0.2.0 Production on Wed Oct 26 13:07:26 2011
Copyright (c) 1982, 2010, Oracle. All rights reserved.
Enter user-name: test
Enter password:
Connected to:
Oracle Database 11g Enterprise Edition Release 11.2.0.2.0 - Production
With the Partitioning, OLAP, Data Mining and Real Application Testing options
SQL>
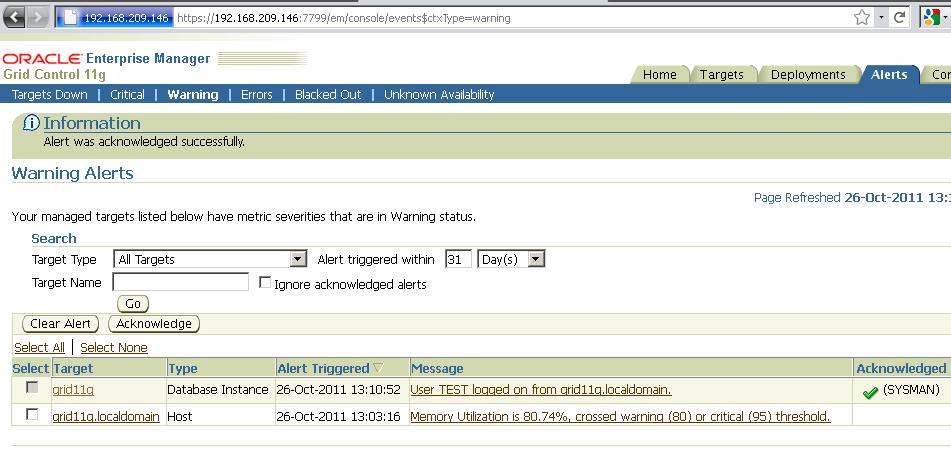
And here is the alert:
[oracle@grid11g ~]$ sqlplus
SQL*Plus: Release 11.2.0.2.0 Production on Wed Oct 26 13:07:26 2011
Copyright (c) 1982, 2010, Oracle. All rights reserved.
Enter user-name: test
Enter password:
Connected to:
Oracle Database 11g Enterprise Edition Release 11.2.0.2.0 - Production
With the Partitioning, OLAP, Data Mining and Real Application Testing options
SQL>
And here is the alert:
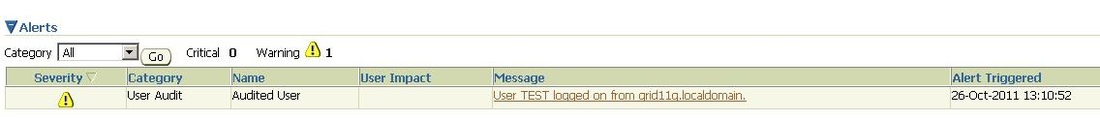
You can see the alerts in the "Alert" tab on the home screen:
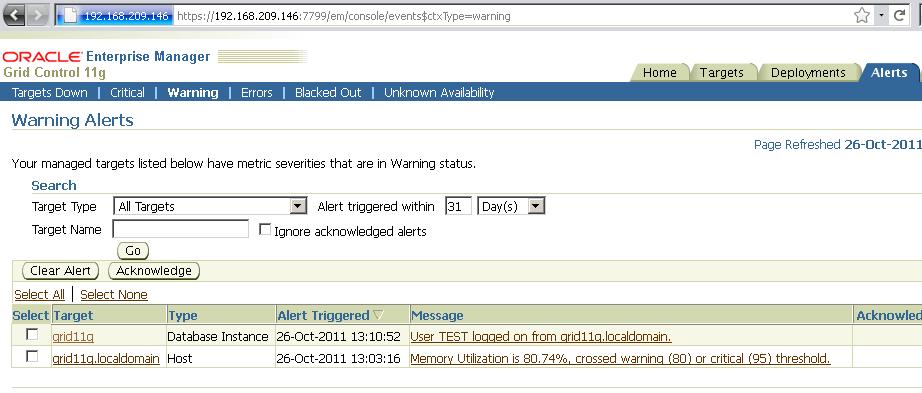
To clear or acknowledge the error, check the alert you want to clear and then click on the "Clear Alert" or "Acknowledge" button.